Introduction
The Reporting Hub shows utilization-oriented metrics, charts, and generated reports — often scoped by employer group or all clients.
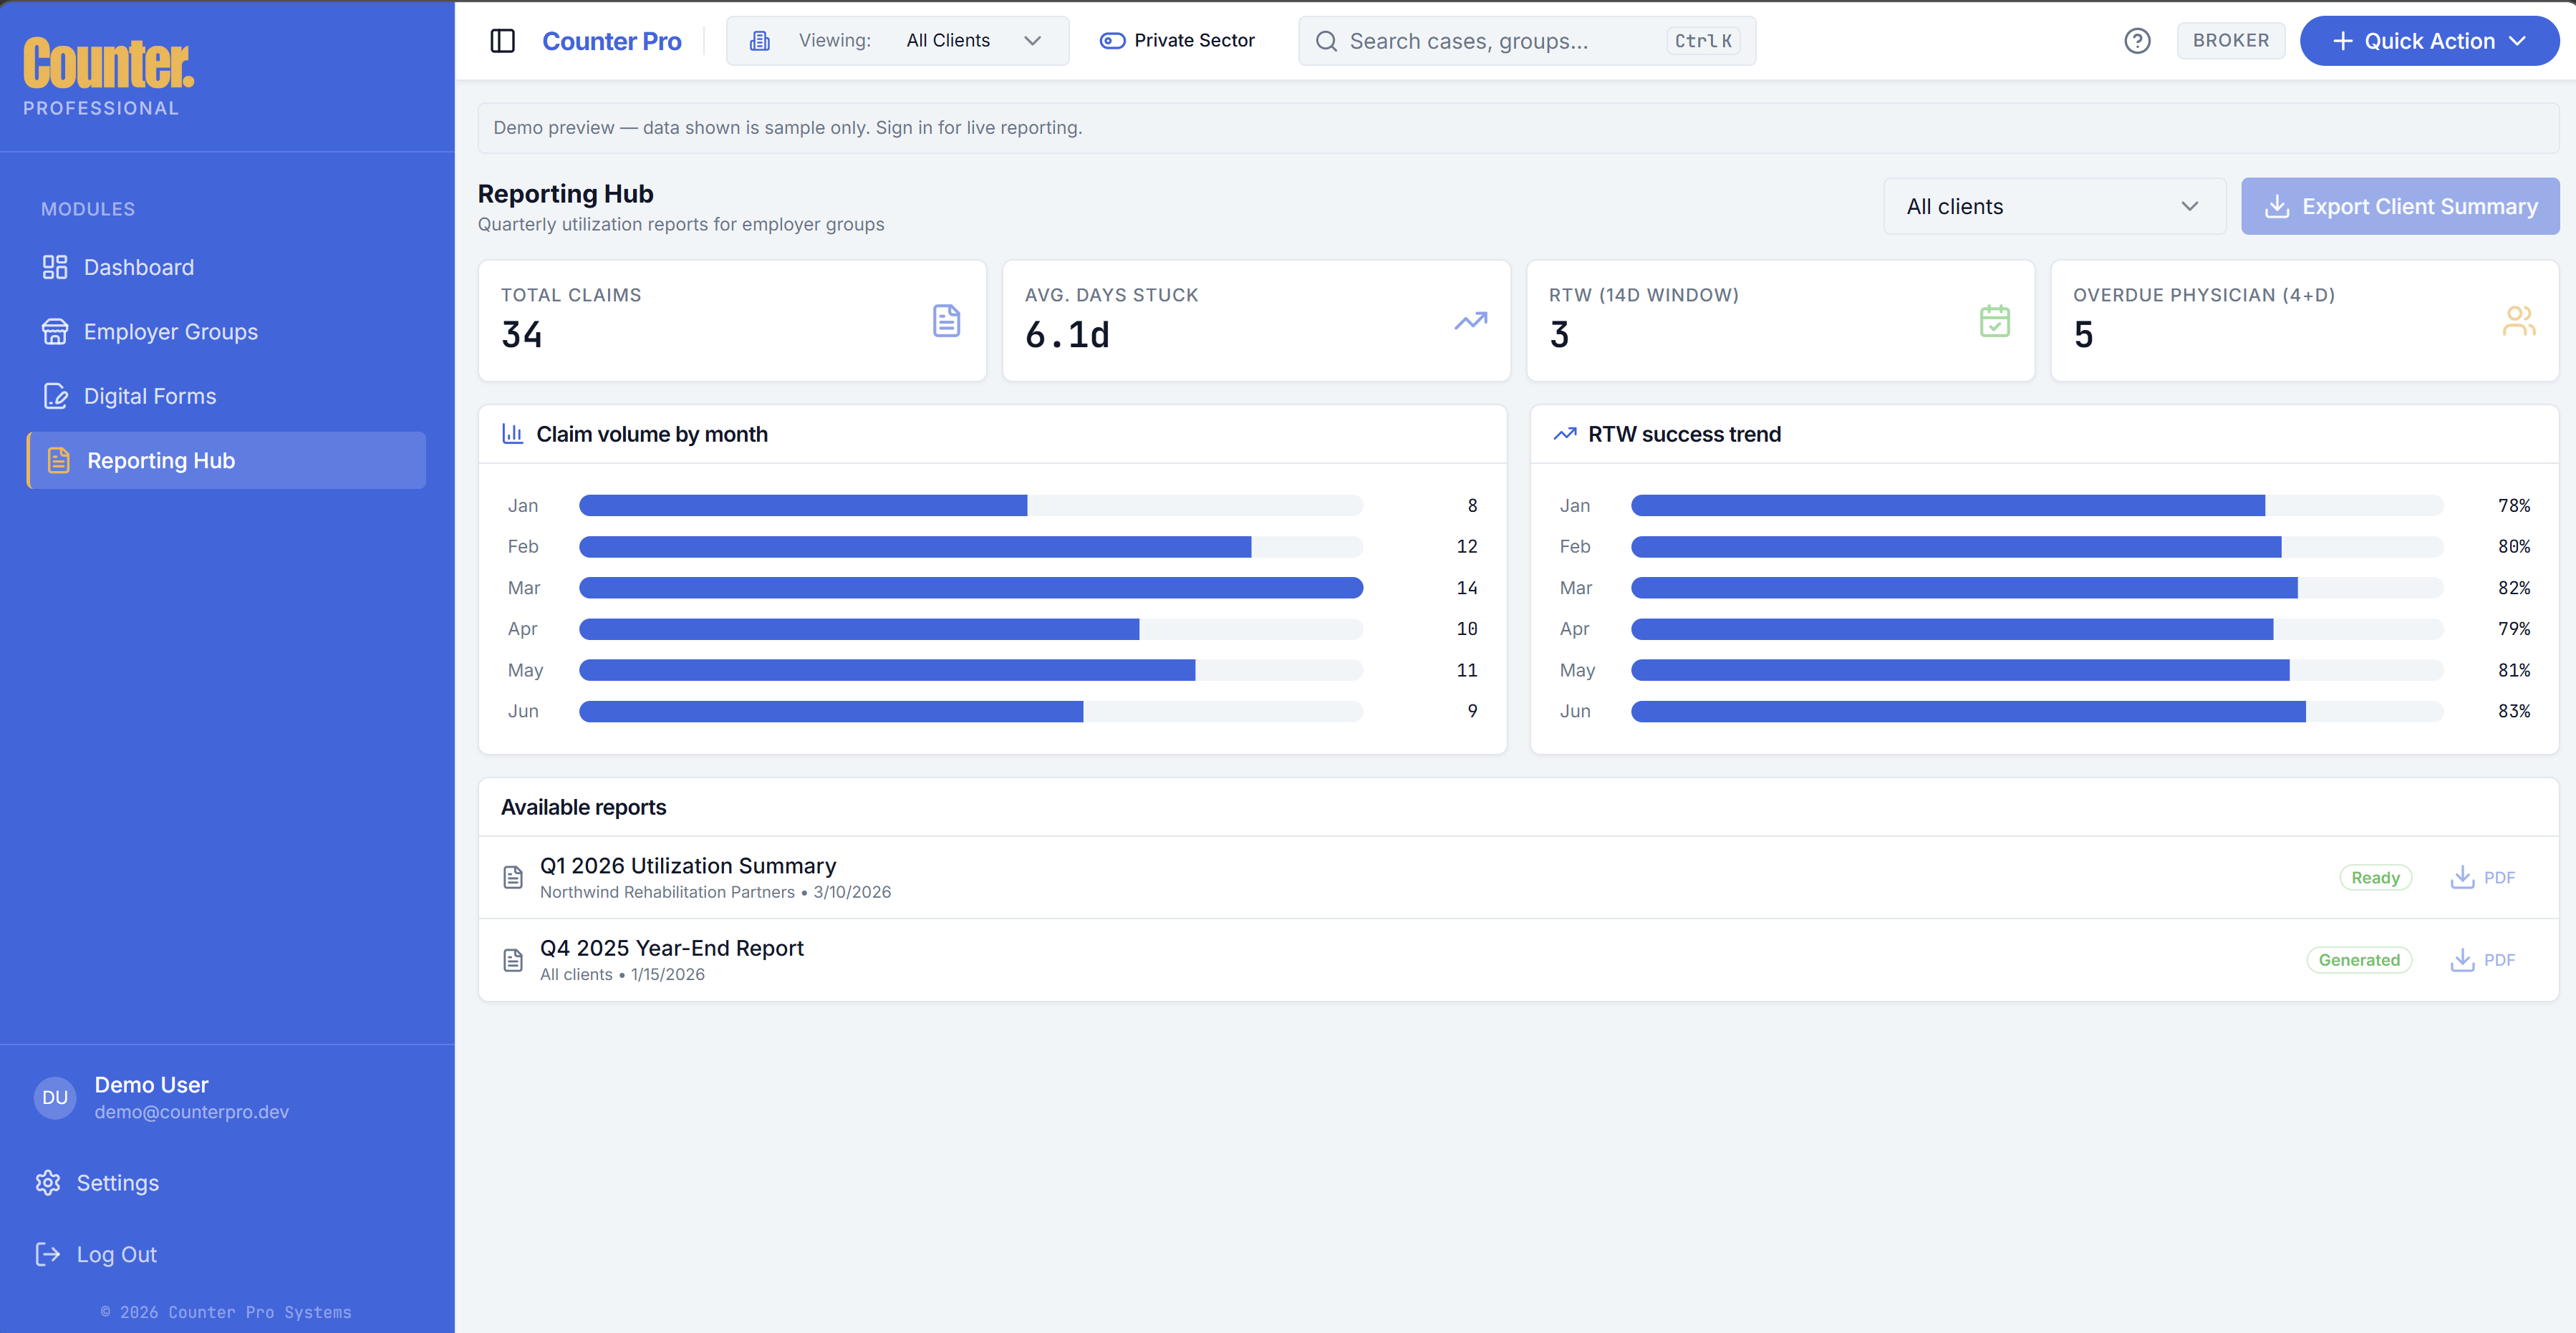
Metrics and charts
Typical views include:
- Open vs resolved volume
- Averages and aging (for example overdue physician actions)
- Upcoming return-to-work windows
- Monthly or trend charts for volume and return-to-work rate
Demo environments may show sample data; production reflects your firm’s cases.
Quarterly and exports
- Generate Quarterly Report is available from the header Quick Action menu (Dashboard).
- CSV or similar export options may appear where your build supports them.
Report history
A generated reports list shows downloadable or ready quarterly-style outputs tied to employer groups.